This is in response to different values shown for the same datapoint when
selecting different time intervals on the mailing list.
Raw data:
$ ./src/tsdb scan --import 2001/09/08 sum m
m 1000000000 12 host=foo
m 1000000003 4 host=foo
m 1000000009 10 host=foo
m 1000000003 10 host=bar
m 1000000008 2 host=bar
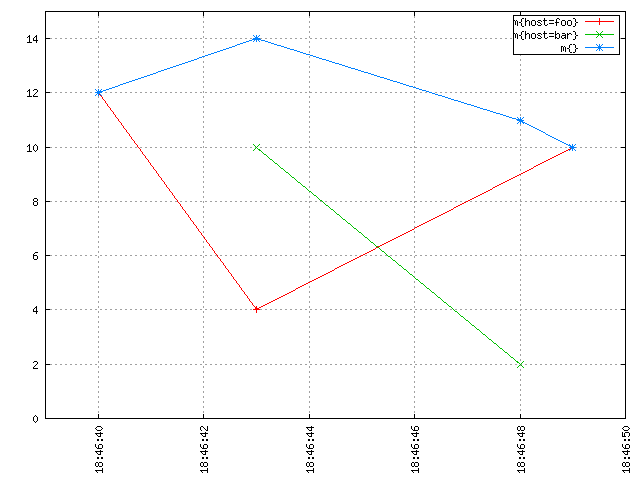
Question is: with the data above, what should the "sum of m" look like?
With linear interpolation (lerp), we get (current behavior):
 Without lerp:
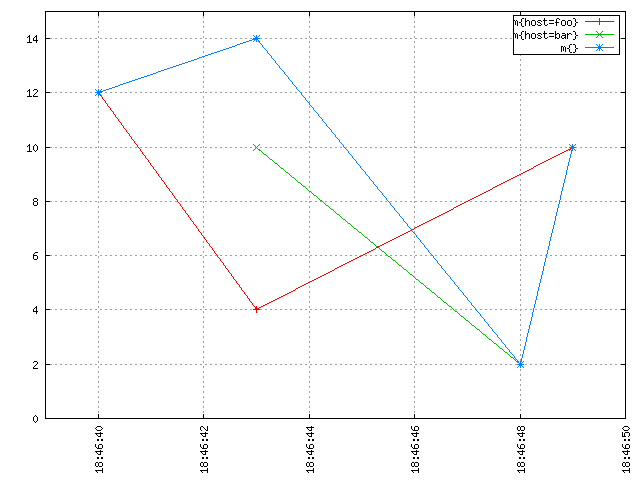 The 2nd image should make it clear that lerp is needed. The blue line cannot
possibly be the sum of the green line and the red line on the 2nd graph.
The 2nd image should make it clear that lerp is needed. The blue line cannot
possibly be the sum of the green line and the red line on the 2nd graph.